What the JPEG Quality Slider Actually Does (It's Not What You Think)
Most users treat the JPEG quality slider as a simple fidelity percentage where 100 represents a perfect copy and 50 represents half the original detail. While this idea is common, it is simply not how the compression math works.
This slider is one of the most misunderstood controls in all of digital imaging. It doesn't represent a percentage of anything. A drop from 100 to 90 does not result in the same change as a drop from 20 to 10, and the number does not correspond directly to how an image looks. Turning it to 100 doesn't give you a lossless file. Understanding what the slider actually does leads to better decisions about exports, saving disk space without sacrificing visible detail.
How the Slider Maps to Quantization
When you save a JPEG, your image goes through a process called Discrete Cosine Transform(DCT) . This algorithm breaks your image into 8x8 pixel blocks, then converts each block from pixel colors into frequency components. Think of it like breaking a musical chord into its individual notes. Low frequencies are the broad tones and gradients, while high frequencies are the sharp edges and fine textures.
The JPEG slider is where the actual destruction happens. After the DCT step, every one of those frequency values gets divided by a number from a Quantization Table. The result is then rounded to the nearest integer. That rounding is where information actually dies. It is irreversible and permanent.
The quality slider controls how aggressive those divisors are. At high quality settings, the divisors are small, so the rounding barely changes anything. At low quality settings, the divisors get large and the rounding obliterates subtle details. High-frequency components like fine textures and crisp edges are affected most, because their divisors scale up faster.
The slider isn't a percentage of quality. It's a set of instructions for how to round off frequency data.
Why 100% Quality Isn't Uncompressed
Saving at quality 100 doesn't produce a bit-for-bit reproduction of your original image. Even at the highest setting, JPEG still changes your image data in two significant ways.
First, most encoders use Chroma Subsampling. Your image is converted from RGB to the YCbCr color space, which separates brightness from color. Because the human eye is less sensitive to color than brightness, the algorithm often throws away 75% of the color detail before the actual compression even starts.Second, the math itself isn't perfect. Even with the smallest possible divisors in the Quantization Table, the process of converting pixels to frequencies and back again involves tiny rounding errors. These small numerical discrepancies mean the resulting pixels won't be identical to the ones you started with. If you need a perfect match, you've to use a lossless format like PNG, TIFF, or WebP Lossless
Quality Ranges and What They Produce
Testing and pixel-level comparison identifies two ranges that cover almost every use case..
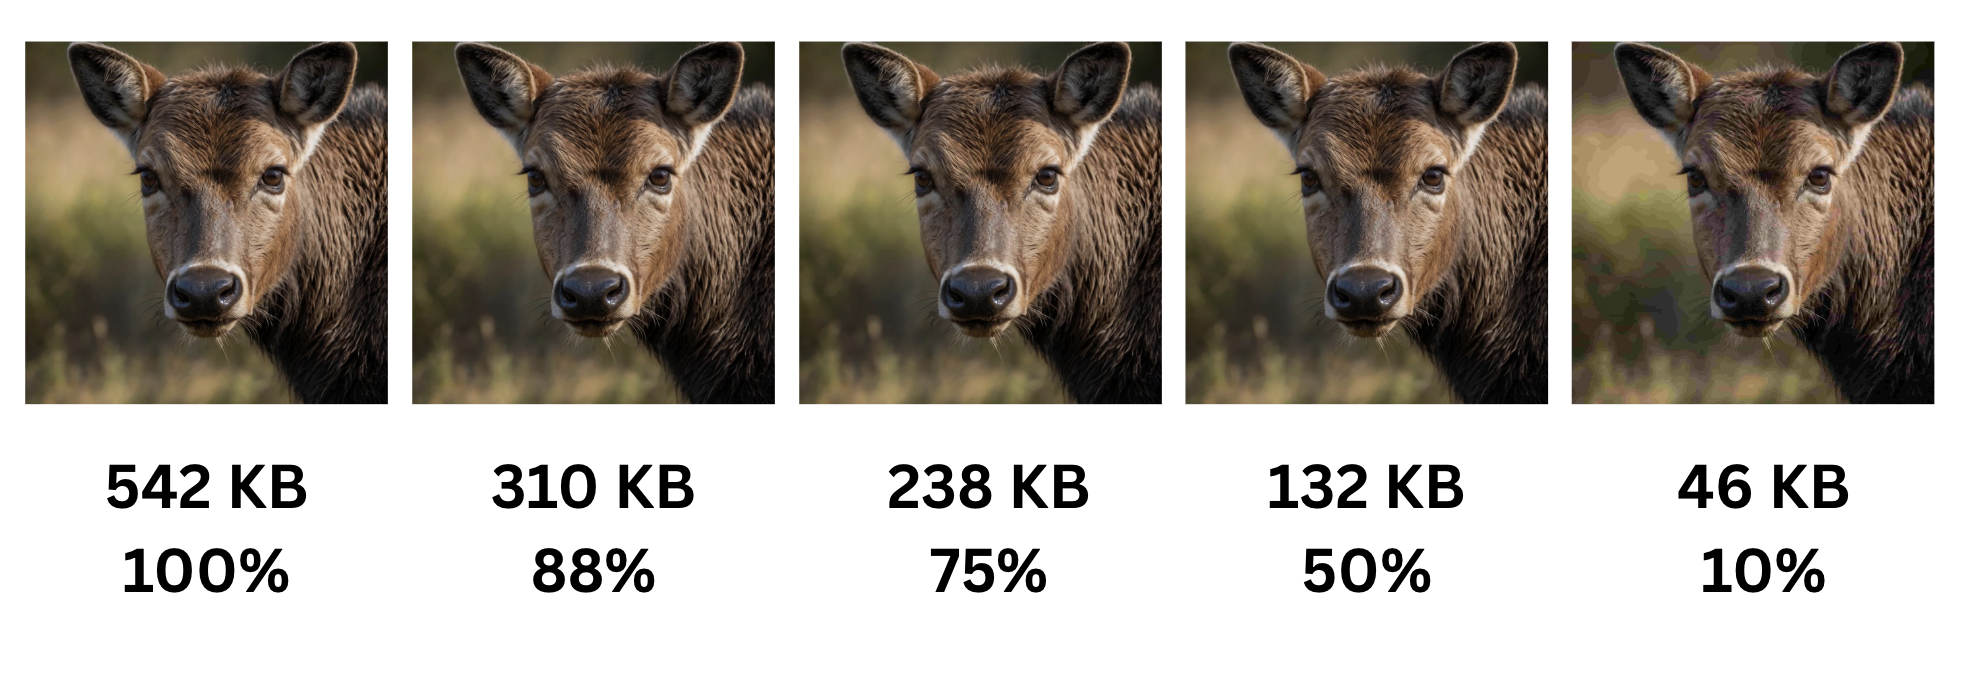
- ➤ 85-92 (The Keeper Range): This is the correct setting for photos worth preserving, such as portfolio work or client deliverables. At quality 90, a file is typically 8-12x smaller than uncompressed, yet the differences are invisible to the human eye. You'd need to zoom to 400% to spot any variations.
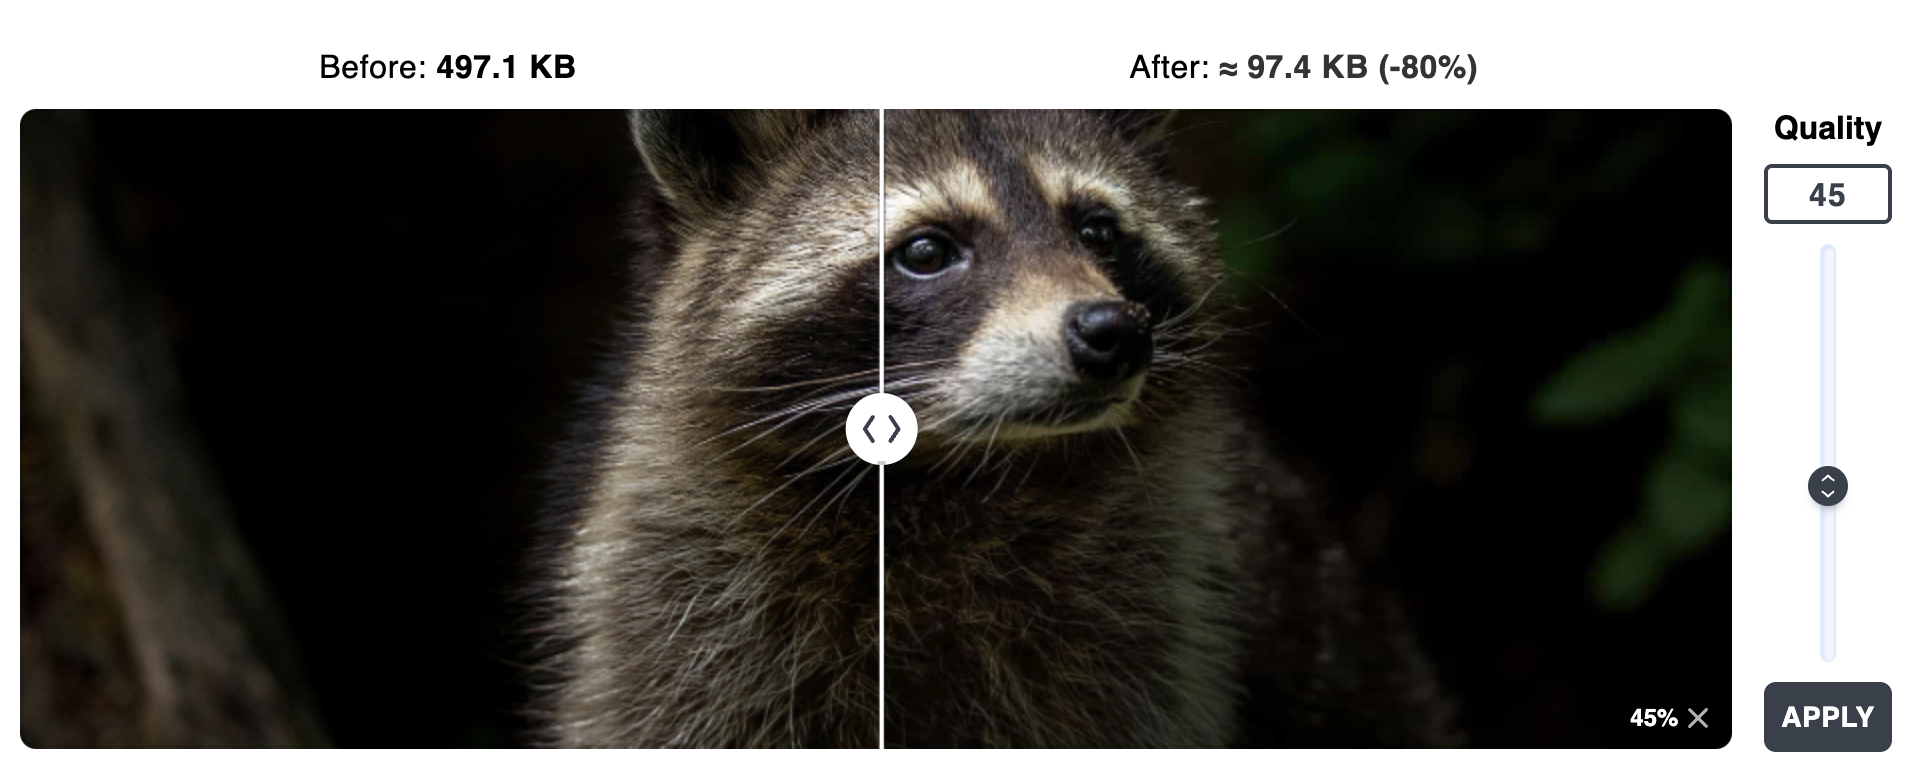
- ➤ 75-82 (The Web Range): This is the pragmatic zone for websites and social media. Files are often 40-60% smaller than the keeper range. The visual tradeoffs are minor, such as slight softening in complex textures.
Choosing between these ranges is a choice between archival precision and practical efficiency. Defaulting to 100 out of anxiety is always the wrong choice.
Why Below 60 Falls Apart
Dropping the slider below 60 causes a sudden, steep decline in quality. At these settings, the quantization divisors for high-frequency components become so large that the values round to zero. Entire categories of visual information, such as hair strands, fabric weave, and text serifs, simply vanish.
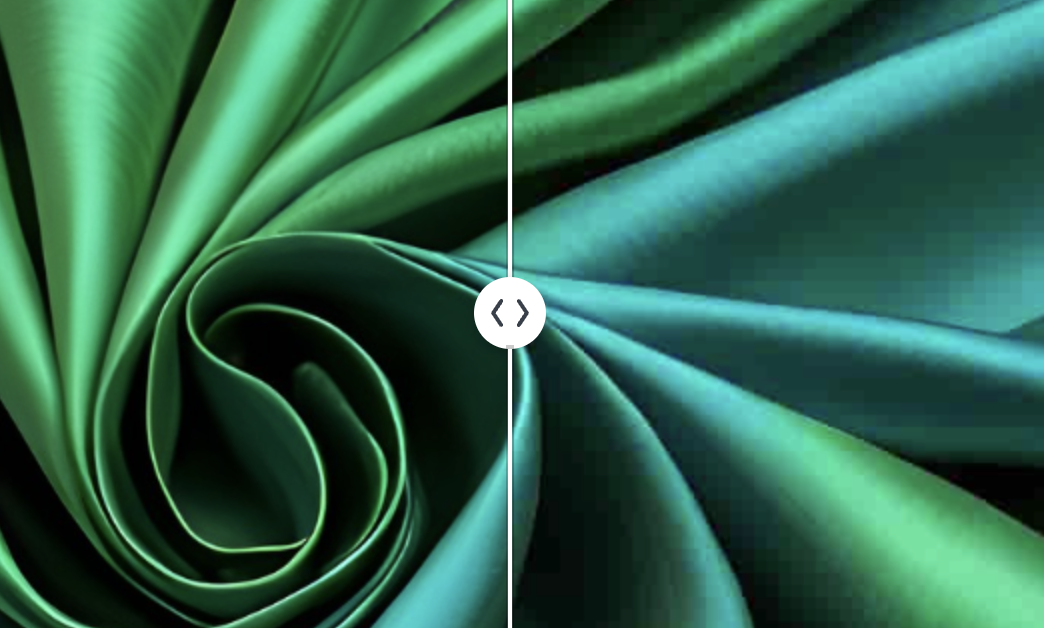
What remains are JPEG Artifacts: blocky 8x8 grids, color banding, and mosquito noise around sharp edges. While low-frequency information like basic shapes might survive, the image becomes unusable for anything a human is meant to actually view. 60 is the effective floor for standard imagery.
Not All 90s Are Created Equal
JPEG quality 90 isn't a universal standard. The JPEG specification defines the quantization tables, but each software vendor maps their slider to those tables differently.
| Software | Scale | "High-quality" setting |
|---|---|---|
| Photoshop | 0 – 12 | 10 (roughly equivalent to libjpeg 90) |
| GIMP | 1 – 100 | 85 |
| ImageMagick | 1 – 100 | 92 |
| libjpeg | 1 – 100 | 90 (reference implementation) |
Two tools exporting at "quality 85" will not produce identical files. The only reliable way to compare across projects is to look at actual output size and visual result.
SSIM: A Better Way to Measure What You Lose
Because the quality slider is a poor metric for actual fidelity, objective alternatives are required. The Structural Similarity Index Measure (SSIM) is the superior standard. Unlike raw pixel comparisons, SSIM evaluates changes in structural information, brightness, and contrast. This approach mimics how human eyes see rather than just comparing numbers. The metric outputs a score from 0 to 1, where 1 means the images are the same.
| JPEG Quality | SSIM Score | Visual Impact |
|---|---|---|
| 85 | > 0.97 | Visually indistinguishable from source |
| 60 | 0.90 - 0.93 | Minor softening; noticed only under zoom |
| 40 | 0.82 - 0.87 | Obvious degradation; artifacts visible |
These figures offer a clear look at loss that slider values cannot provide. Tools such as ImageMagick allow for precise SSIM calculation, which enables an optimization strategy based on data rather than guessing. Identifying the specific point where file size savings maximize without crossing the perceptual threshold of 0.85 removes the uncertainty of manual selection.
Practical Ranges: 75–82 for Web, 85–92 for Archival
The JPEG quality slider is a math setting for rounding data, not a simple percentage control. It has a nonlinear relationship to both storage size and image quality, and these settings vary across different software. Treating the slider as a simple dial leads to storage waste at high settings and visible image failure at low settings.
High-quality files require a range of 85-92, while web assets work best at 75-82. Exports at quality 100 provide no visible benefit while doubling or tripling file sizes. For precise work, SSIM provides the guidance that the slider cannot. The slider does not intentionally mislead; it simply uses a technical scale that most people mistake for a percentage.